
Days of Negative Price Action on Crude Oil
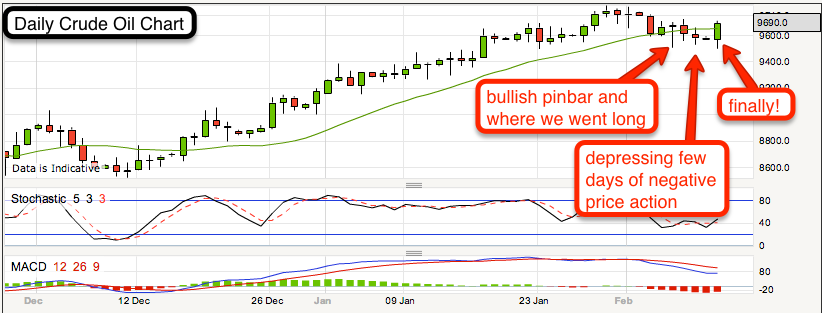
The other trade which I had tweeted out last week was my long Crude Oil trade. Once again, you can see that there was a strong bullish pin bar showing that the buyers were in force. As a Daily chart trader, I entered my trade on the close of the pinbar (ie right at the top of it). The market over the next few days then sank and didn’t look very well. In fact, the price action sank as soon as I went long and price dwindled pretty much at the base of the pin at the 9500 level. I pretty much lost confidence of this trade but today, it woke up and pushed up a 100 points! Unfortunately, that doesn’t mean 100 points profit for me as it’s just brought the price action to where I started. Anyway, you can see from the Crude Oil chart that price has been moving upwards since November. It’s only around now that it’s breached the 20 day MA moving average and if this is just a pullback, we could see the bullish trend continue.
If the price action can break upwards from here, I’d be looking to see if it can go to 9900 or so..
I am still in this trade, go Crude Oil go! Will keep you guys updated via Twitter!


[…] http://www.makemesomemoney.co.uk/days-of-negative-price-action-on-crude-oil/ […]