To Finish off the week, +100 on Crude Oil
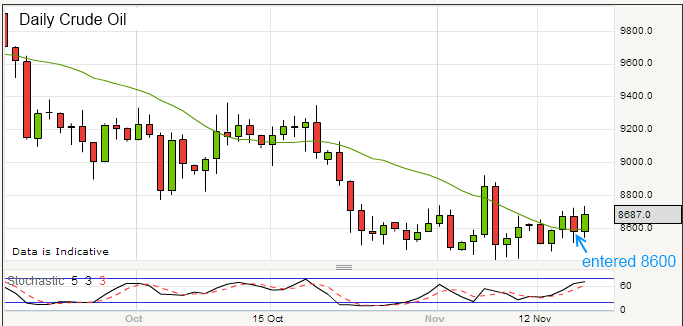
Here’s the daily chart of Crude Oil.. I actually saw the opportunity to trade it but didn’t get a chance to enter until the following morning. The entry I was looking for was 8600 and I got it. From the Daily chart, you don’t really see why I entered, the only clue here is that you can see the the price action seems to have stopped moving down and has just floated between 8500 and 8600 for a good few weeks.
Anyway, if you look at the 2 hour charts, this is what you see:
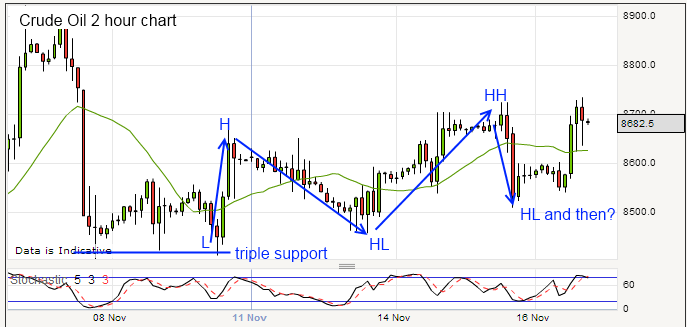
You can see support on the left hand side, the price actually stops dead at around 8400.. it’s quite a hard stop, there are no sellers under this and then you see the pattern of an uptrend… a series of Higher Lowers and Higher Highs… when I saw the Higher Low (HL), it was a buy and I was looking for a price around 8600. You can see that the price dwindled for all of last night and this morning before it moved. I set a target for 100 which was also 8700 and the previous high and got it!


To Finish off the week, +100 on Crude Oil: Here’s the daily chart of Crude Oil.. I actually… http://t.co/EtVfIrYk
[…] http://www.makemesomemoney.co.uk/2012/11/16/to-finish-off-the-week-100-on-crude-oil/ […]