They Psychology of a Failed Break Pattern – Real life example on the GBPUSD
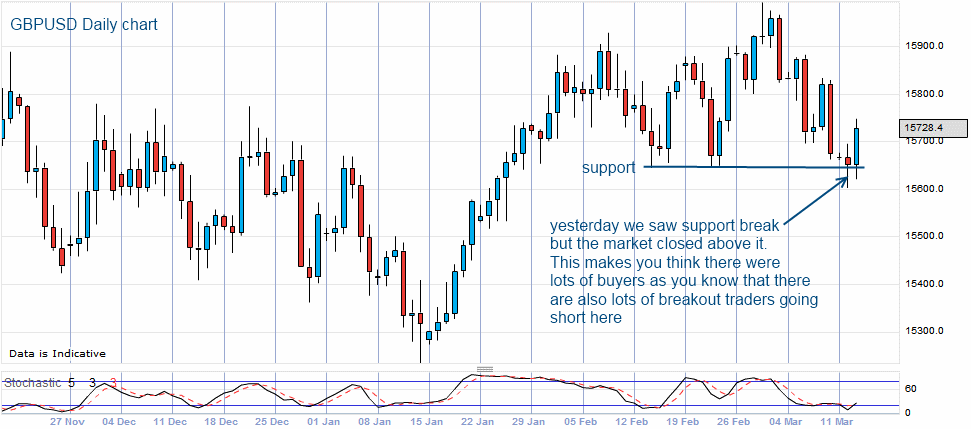
This was something which I saw yesterday but I didn’t have the confidence to trade it and didn’t. I had emailed this to a few of my trading friends to get their view but they weren’t sure either. Anyway, imagine the chart below but without todays up bar.
The way I saw it was this, there was an obvious support as draw below at approximately the 15650 level which can be seen very clearly in the daily charts. The market had bounced off this a few times already as you can see. With the latest price action, you can imagine that a break of this level will interest a lot of traders… For those breakout traders and I know that there are many, this is a signal to go lower. I know that there would have been a lot of shorts here as the market broke but what is interesting is that when you look at the daily candle after it had closed, it closed just above the support level. This tells me that there were a lot of buyers below the support level, absorbing all the sell orders. At levels like this, the level will either collapse or shoot up the other day. As the market hadn’t collapse, I was thinking about putting on a long entry with a stop at the low of the day.
I was thinking about it all last night and this morning and figured that all this thinking meant that I wasn’t sure and therefore left it. The market didn’t do much until the US open today when it did, in fact, shoot up as you can see… If I had placed my order, I would be a nice 80 pips up.
Anyway, I just wanted to post this as I feel that it is an interesting pattern and a reminder to myself.


