
EURJPY – The one that got away!
My EURJPY trade earlier this week saw me get in the trade at a great place… however, once again, I fluffed the exit. The chart is below:
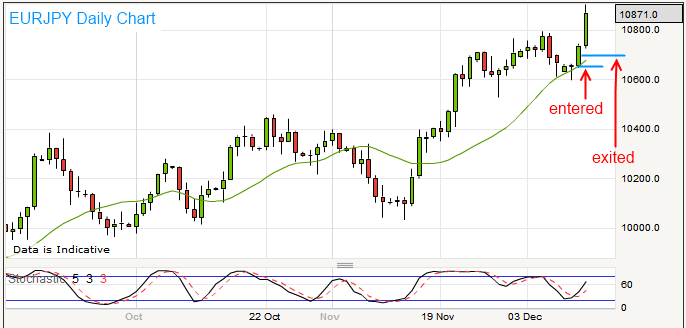
The horizontal blue lines show where I entered and exited. I entered at 10657 after seeing the pinbar. I got a little wrapped up in the lower timeframe charts and saw resistance at 10700 and close the trade. I took 40 pips on the trade. You can see that the trade has since moved another 170 pips beyond my exit.. if I was still in this trade I would be 210 pips up compared with what I did end up with.
Anyway, it’s good for me to post these up.. I find it helps me reinforce good habits and work to banish areas which need improvement in my trading psychology.