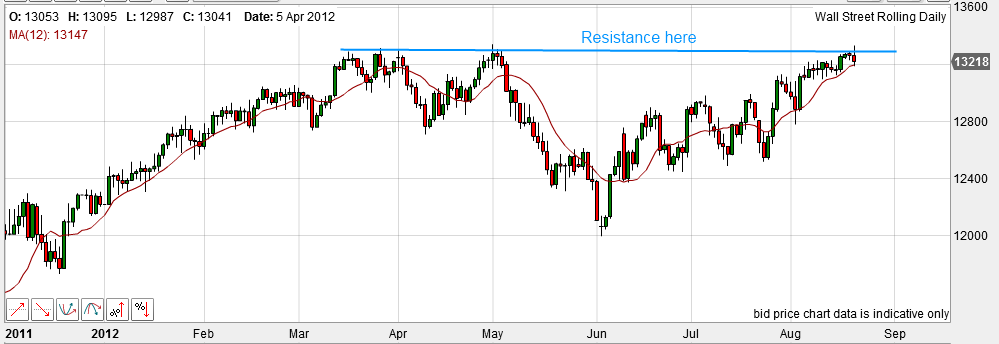
DOW JONES hits critical Resistance Level… what next?
This is an interesting chart of the Dow Jones chart under the Daily timeframe.
Basically support and resistance levels can sometimes be the easiest way to get into a trade. The longer timeframes such as the Daily and Weekly charts are much more solid charts to trade off but they are for those who are more patient with their trading. I recommend the Daily charts for those who want to trade a few times a week and have other interests or a full time job.
Anyway, back to the trading, from the Daily chart of the Dow today, you can see that the previous resistance which was hit a few times in the latter weeks of March and then start of May.. I’d say around 13270 +/- 20 points or so was hit again today by the Dow followed by a hard sell off.
Someone once said to me that the best places to place trades are at danger points such as these but looking at the chart, it sure is a dangerous place to put a trade. The market could fall hard from here as it has hit the resistance level but if you look at the market since June, it has clearly been in an uptrend.
If you were to short this, you would need a hefty 140 points as a stop to know that you were wrong.. it’s quite a big stop! I’m always playing my odds so I’ve entered short here.. let’s see how it goes. If I’m wrong, I’ll lose my 1%!

 ..
..


