Posts Tagged financial markets
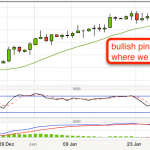
The other trade which I had tweeted out last week was my long Crude Oil trade. Once again, you can see that there was a strong bullish pin bar showing that the buyers were in force. As a Daily chart trader, I entered my trade on the close of the pinbar (ie right at the top of it). The market over the next few days then sank and didn't look very well. In fact, the price action sank as soon as I went long and price dwindled pretty much at the base of the pin at the 9500 level. I pretty much lo
February 11, 2013
1 Comment Full Story
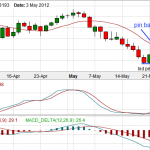
I went long on the DOW the other day, see the daily chart of the Dow below... it had hit support and the second time it did so, there was a pin bar pattern indicating strength with the buyers. The second day, you can see continued strength but today, there has been some selling. I went long at the break of the nose of the pin bar and my stop is 5 pips under the bottom of the pin. The trend is down however but this is a reversal play. It is risky considering how weak the market is but this could
May 25, 2012
No Comments Full Story
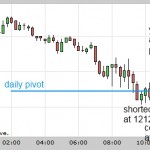
The markets have been rather choppy where pullbacks have been quite large. I've been focusing on the 15 minute charts to grab a few pips here and there. Here is what I did today.
My first trade was crude oil. I could see that a 'W' pattern had formed in the 15 minutes. I had talked about the W pattern before in previous posts on the blog.. you can read one here:
http://www.makemesomemoney.co.uk/2011/09/01/the-w-pattern-in-oil-price/
It's basically the market finding support. I went
December 12, 2011
No Comments Full Story
« Older Entries