Posts Tagged dow resistance
..
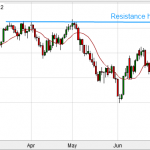
This is an interesting chart of the Dow Jones chart under the Daily timeframe.
Basically support and resistance levels can sometimes be the easiest way to get into a trade. The longer timeframes such as the Daily and Weekly charts are much more solid charts to trade off but they are for those who are more patient with their trading. I recommend the Daily charts for those who want to trade a few times a week and have other interests or a full time job.
Anyway, back to the trading, f
August 21, 2012
No Comments Full Story
I'm doing my usual analysis of the markets taking signals and trades of the Daily timeframes. The one that looks interesting today is the DOW, see pic below:
Now you have to bear caution as the market is clearly in an uptrend.. however, the price action over the past week, looking at the daily charts, shows us that there seems be a band of resistance where the price is unable to get beyond. Of course, the markets can do anything but this does look like a worthwhile trade taking a 1:1 risk
August 14, 2012
No Comments Full Story
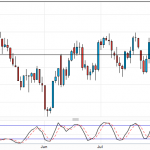
![Went Long on DOW as it broke resistance]()
So today the DOW had been not doing much bouncing between 10300 and 10380. I was looking for a break either up or down to time my entry. I had an order at 10403 which was above the range but also above the round number.. round numbers are always areas of relatively strong resistance so I was mindful of that.
Additionally, the pivot was around 10429 or so which would be another hindrance to price moving upwards.
Anyway, my long was trigger and I managed to grab 25 points which was pretty aw
July 23, 2010
No Comments Full Story
« Older Entries