Posts Tagged double bottom
If you study stock price patterns, no doubt you would have come across the W or M pattern. These are also double bottom or double top patterns and signify potential reversals in the underlying asset class.
If you want to read more, there's a nice article on Investopedia:
http://www.investopedia.com/university/charts/charts4.asp#axzz1WgQnxMpY
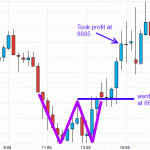
Anyway, these patterns can persist in all timeframes and I saw and traded oil with it last night.
You can see that oil price made a W (outli
September 1, 2011
2 Comments Full Story
I also put in a short trade on the CHFJPY with a trailing 50 point stop loss. The market hit a double bottom at 100.18 and has bounced up to hit the 61.8% Fibonacci level. The stochastics have also crossed towards the downside. All looks good you may say.. however, I am not 100% confident of this trade for the following reasons:
The stochastics crossed at the 60 level. A clean cross should happen either above 80 and move downwards or below 20 and move upwards
Very strong upwards momentum
June 2, 2008
No Comments Full Story
I made one trade today, long 141225 when the 4 min stoch and MACD were looking like they were heading up. The 15 min stoch also was heading up… I was cautious as the MACD was still in a sell state.
I bought in and the market moved quickly upwards, it reached my 10 prices and I moved stop to breakeven. However, soon after this market fell and stop got hit. I ended up with no loss or win…
January 11, 2008
No Comments Full Story