Archive for November, 2012
You've heard the term, a picture says a thousand words. However, pictures combined with words and data can be extremely effective. Infographics are pictures which depict information in an easy to read format. As it's the weekend and there is no trading to be done, I thought it would be fun and interesting to post some infographics which I found which relate to trading.
If you visit the link below, you'll see 3 that I found:
http://pinterest.com/makemesomemoney/trading-infographics/
I fo
November 17, 2012
2 Comments Full Story
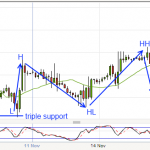
Here's the daily chart of Crude Oil.. I actually saw the opportunity to trade it but didn't get a chance to enter until the following morning. The entry I was looking for was 8600 and I got it. From the Daily chart, you don't really see why I entered, the only clue here is that you can see the the price action seems to have stopped moving down and has just floated between 8500 and 8600 for a good few weeks.
Anyway, if you look at the 2 hour charts, this is what you see:
You can see
November 16, 2012
2 Comments Full Story
I entered long silver last night. From the chart, it looked like the price action was retracing before a further move upwards. Something which has been bothering me lately are my exits so I think I am going to open two trades and close one when my usual signals tell me to and then try and hold the other trade for bigger gains.
So I was long silver twice at 3243 with a stop at 3194. When I woke up in the morning, the price had bottomed at 3220 and I thought it would then move up. It starte
November 13, 2012
1 Comment Full Story
« Older Entries
Newer Entries »