Archive for August, 2012
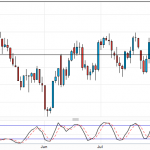
I'm doing my usual analysis of the markets taking signals and trades of the Daily timeframes. The one that looks interesting today is the DOW, see pic below:
Now you have to bear caution as the market is clearly in an uptrend.. however, the price action over the past week, looking at the daily charts, shows us that there seems be a band of resistance where the price is unable to get beyond. Of course, the markets can do anything but this does look like a worthwhile trade taking a 1:1 risk
August 14, 2012
No Comments Full Story
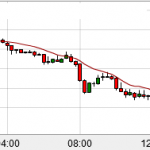
Well I was able to enter the Crude Oil trade last night... seems that the market closes for a couple of hours and reopens at 11.00pm UK time. I entered as soon as it was open and got a price of 9342.
You can see from the chart that resistance there showing selling..
I showed the lowest price of today which would have netted 172 points but it's impossible to know when the trend is going to end and you need to give the trade enough room move.
However, by using the 15 minute charts,
August 10, 2012
No Comments Full Story
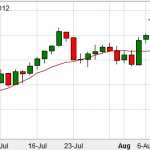
Another interesting chart I have is the daily Crude Oil price. You can see that there is strong resistance and the market has failed to get beyond this point. This could be a potential selling opportunity. The only thing about Crude is that it is very volatile and you need to be very careful with it.
The market is currently closed but when it opens I'll see what the market looks like and may even short it...
Will keep you updated!
August 9, 2012
No Comments Full Story
« Older Entries
Newer Entries »